This interactive canvas was created as a personal project to deepen my domain knowledge but evolved into a tool to allow others in my team to onboard, ideate and strategize. From personas to valuation methods and emerging technologies to data sources, the tool helped my team understand the CRE landscape, spot connections, and drive better product ideation.

“ Make things for each other."
- Jony Ive
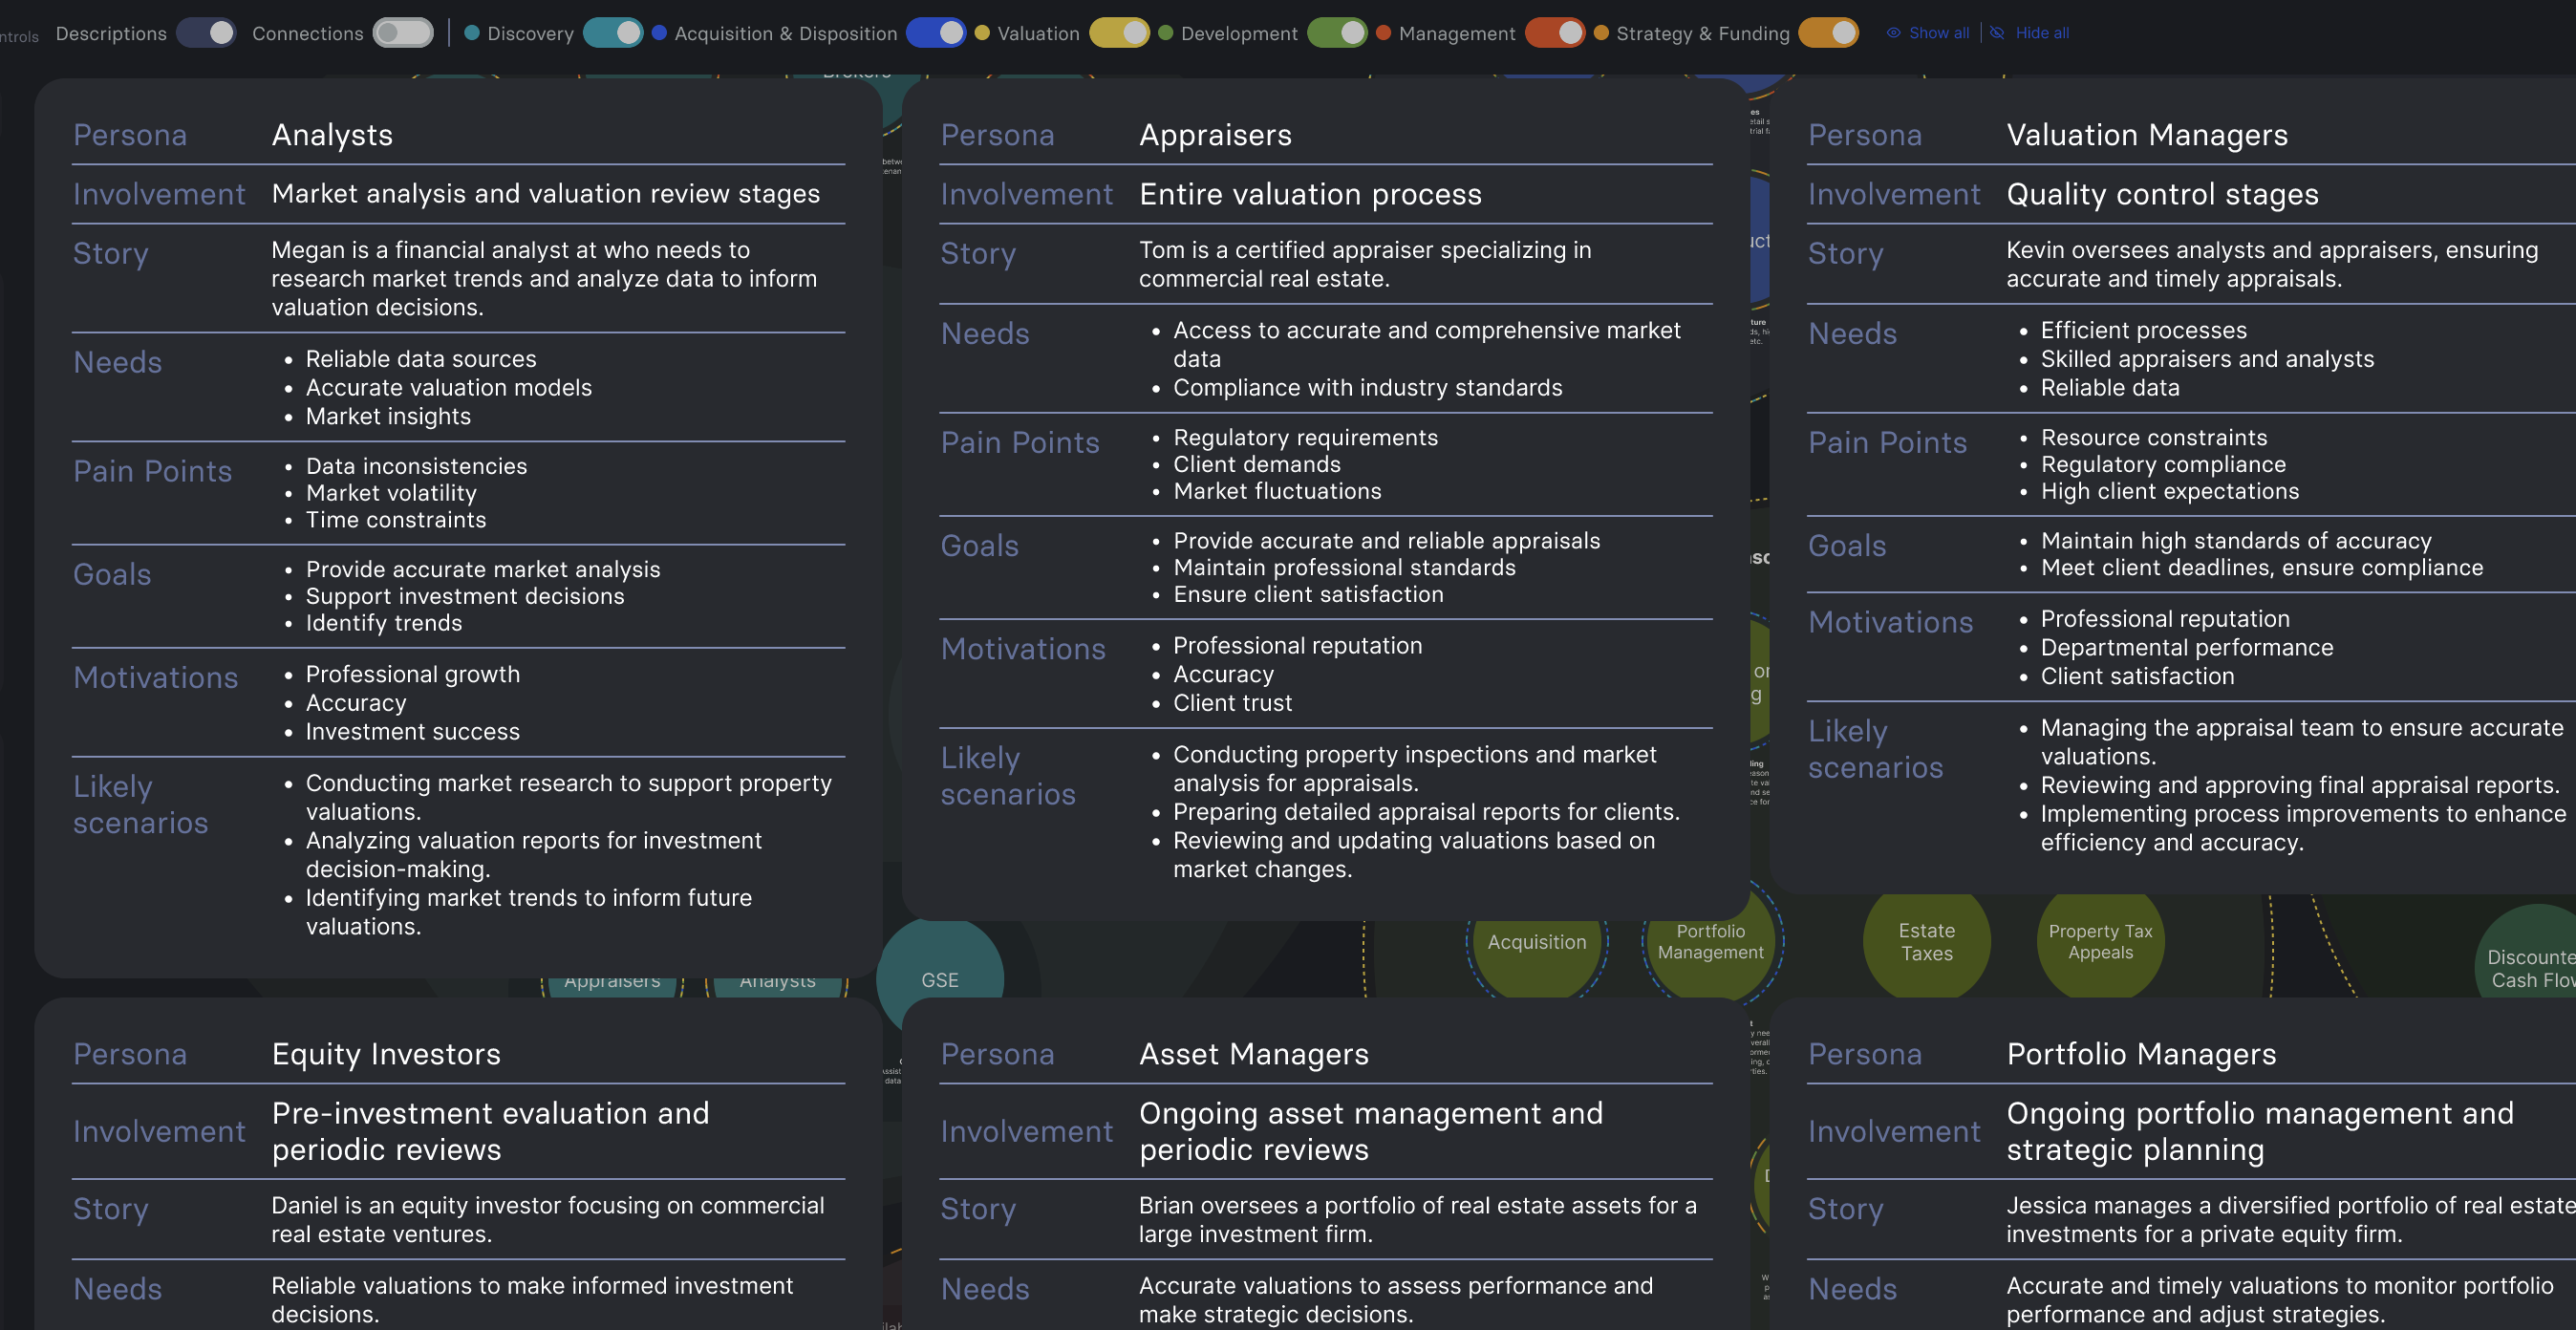
The canvas is interactive and structured around the stages involved in CRE, like:
Discovery, Acquisition & Disposition, Valuation, Development, Management and Strategy & Funding.

Users can toggle these phases on/off depending on their focus. I also included:
- Pop-outs for common personas and use cases
- Tooltips and definitions to clarify CRE-specific terms
- Visual links between stakeholders, data, and others


The canvas became more than just a personal research project, it turned into a valuable resource for the broader team. It was used shared as a part of the lunch and learn sessions to build shared understanding across roles, and shared among the product team to help onboard new employees. By laying out how people, data, tools, and trends interact, the canvas helped demystify complex workflows and served as a conversation starter in early-stage ideation.